

XactInsights
Turn claims data into actionable insights. XactInsights gives claims leaders critical answers faster, through an intuitive interface that learns as you use it and speaks your language, no ticket to IT required.
XactInsights - Insight Analyst
Ask, and the chart answers: the natural-language experience below is Insight Analyst, part of the XactAI package, at work inside XactInsights.
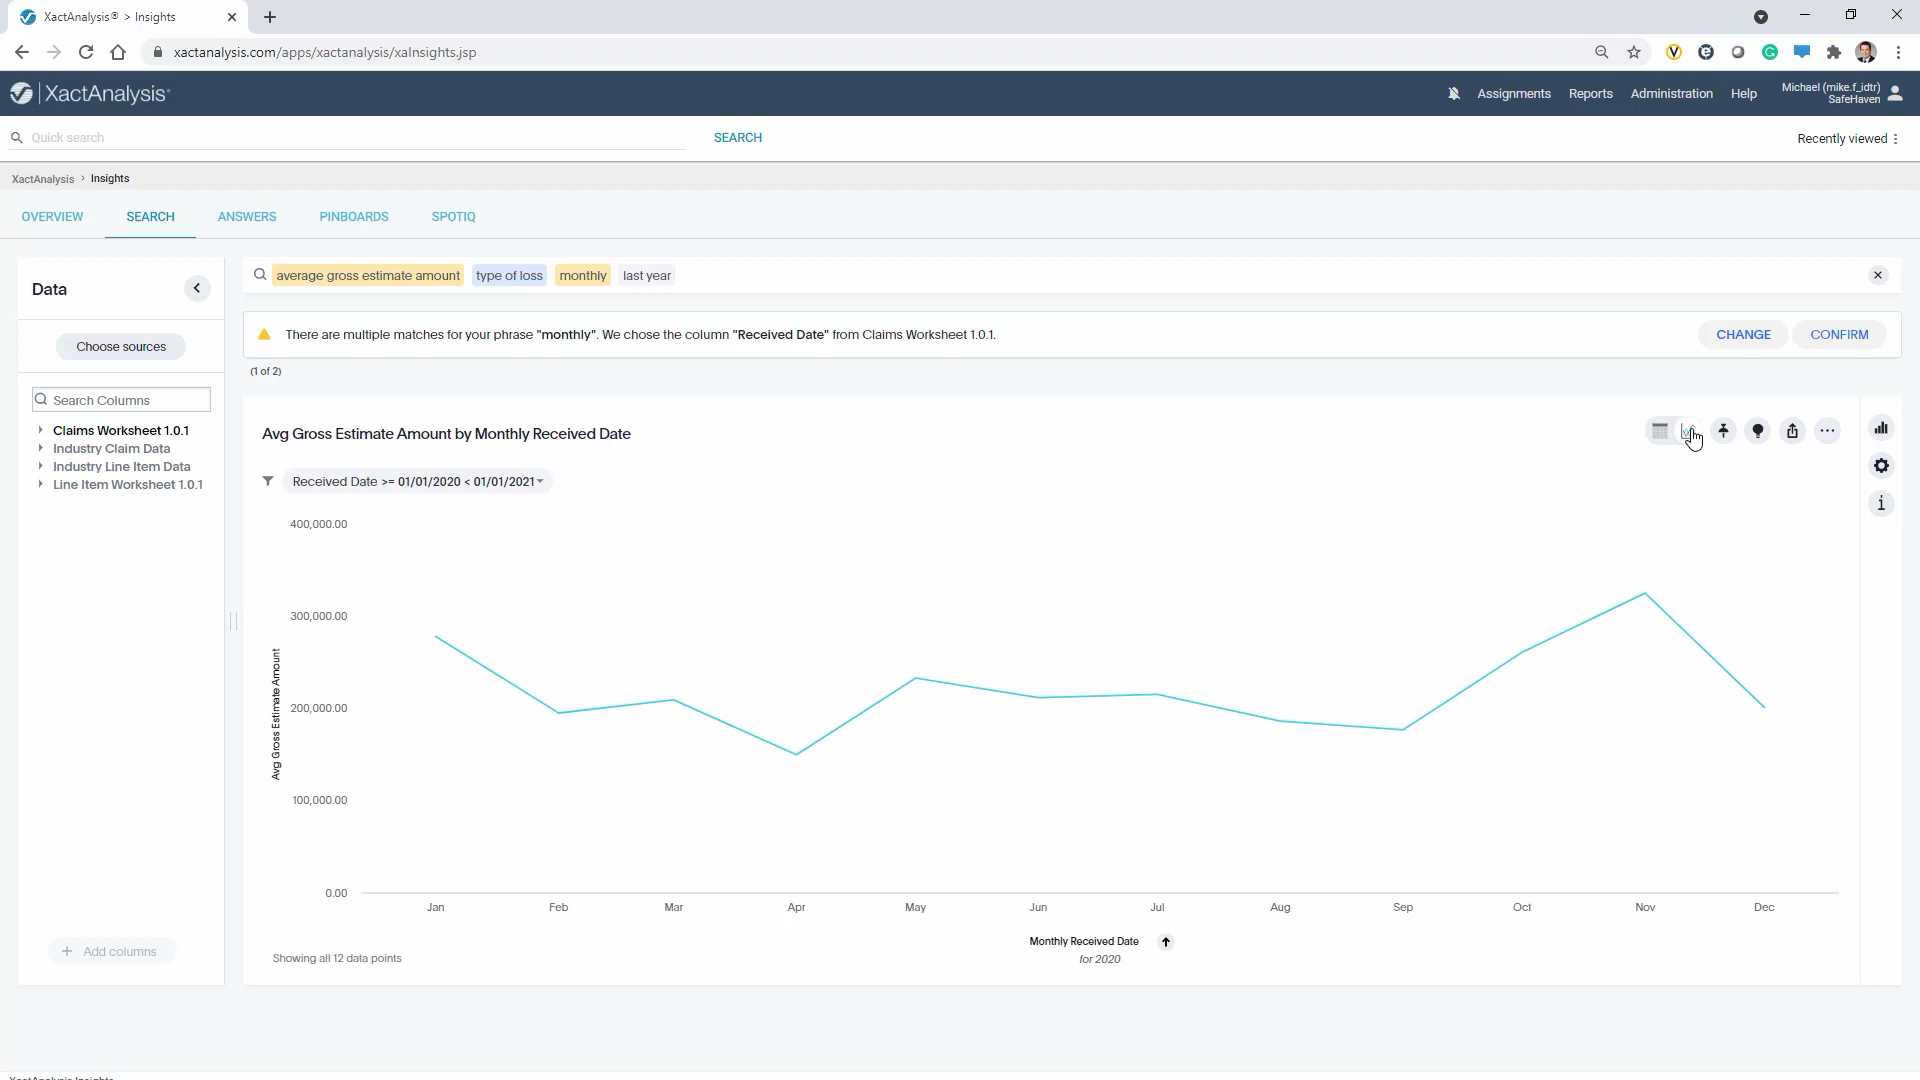
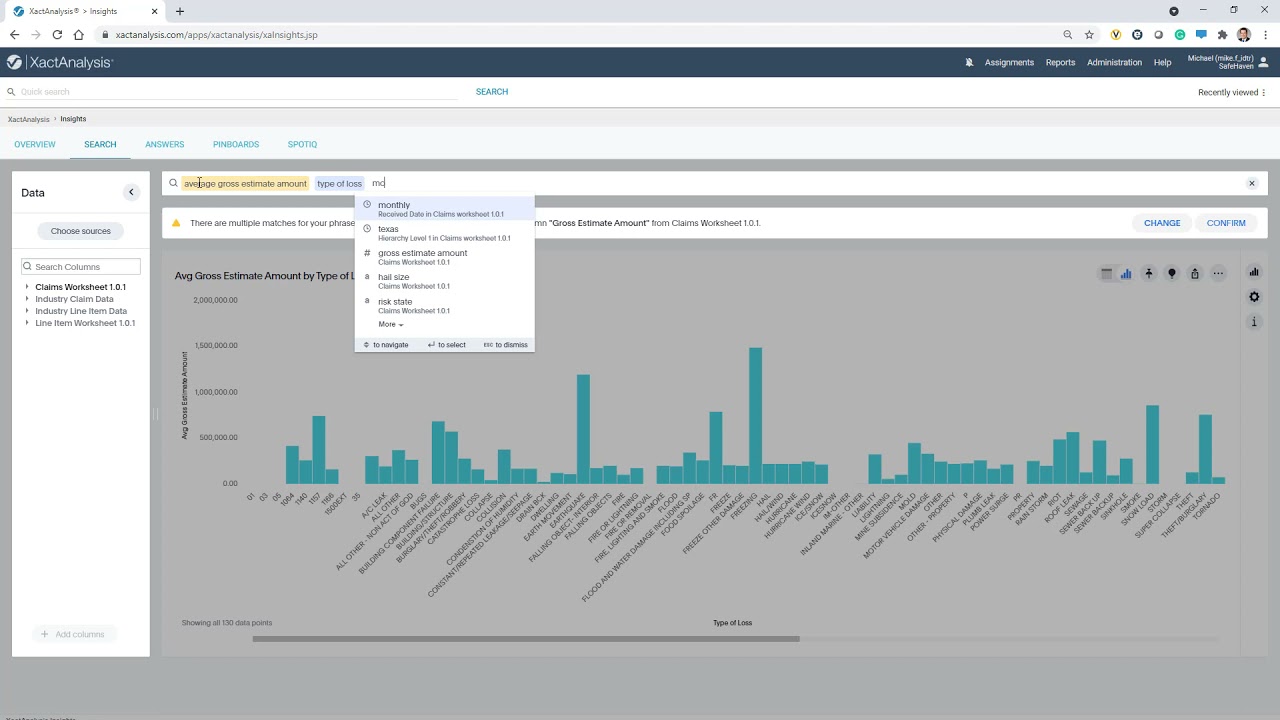
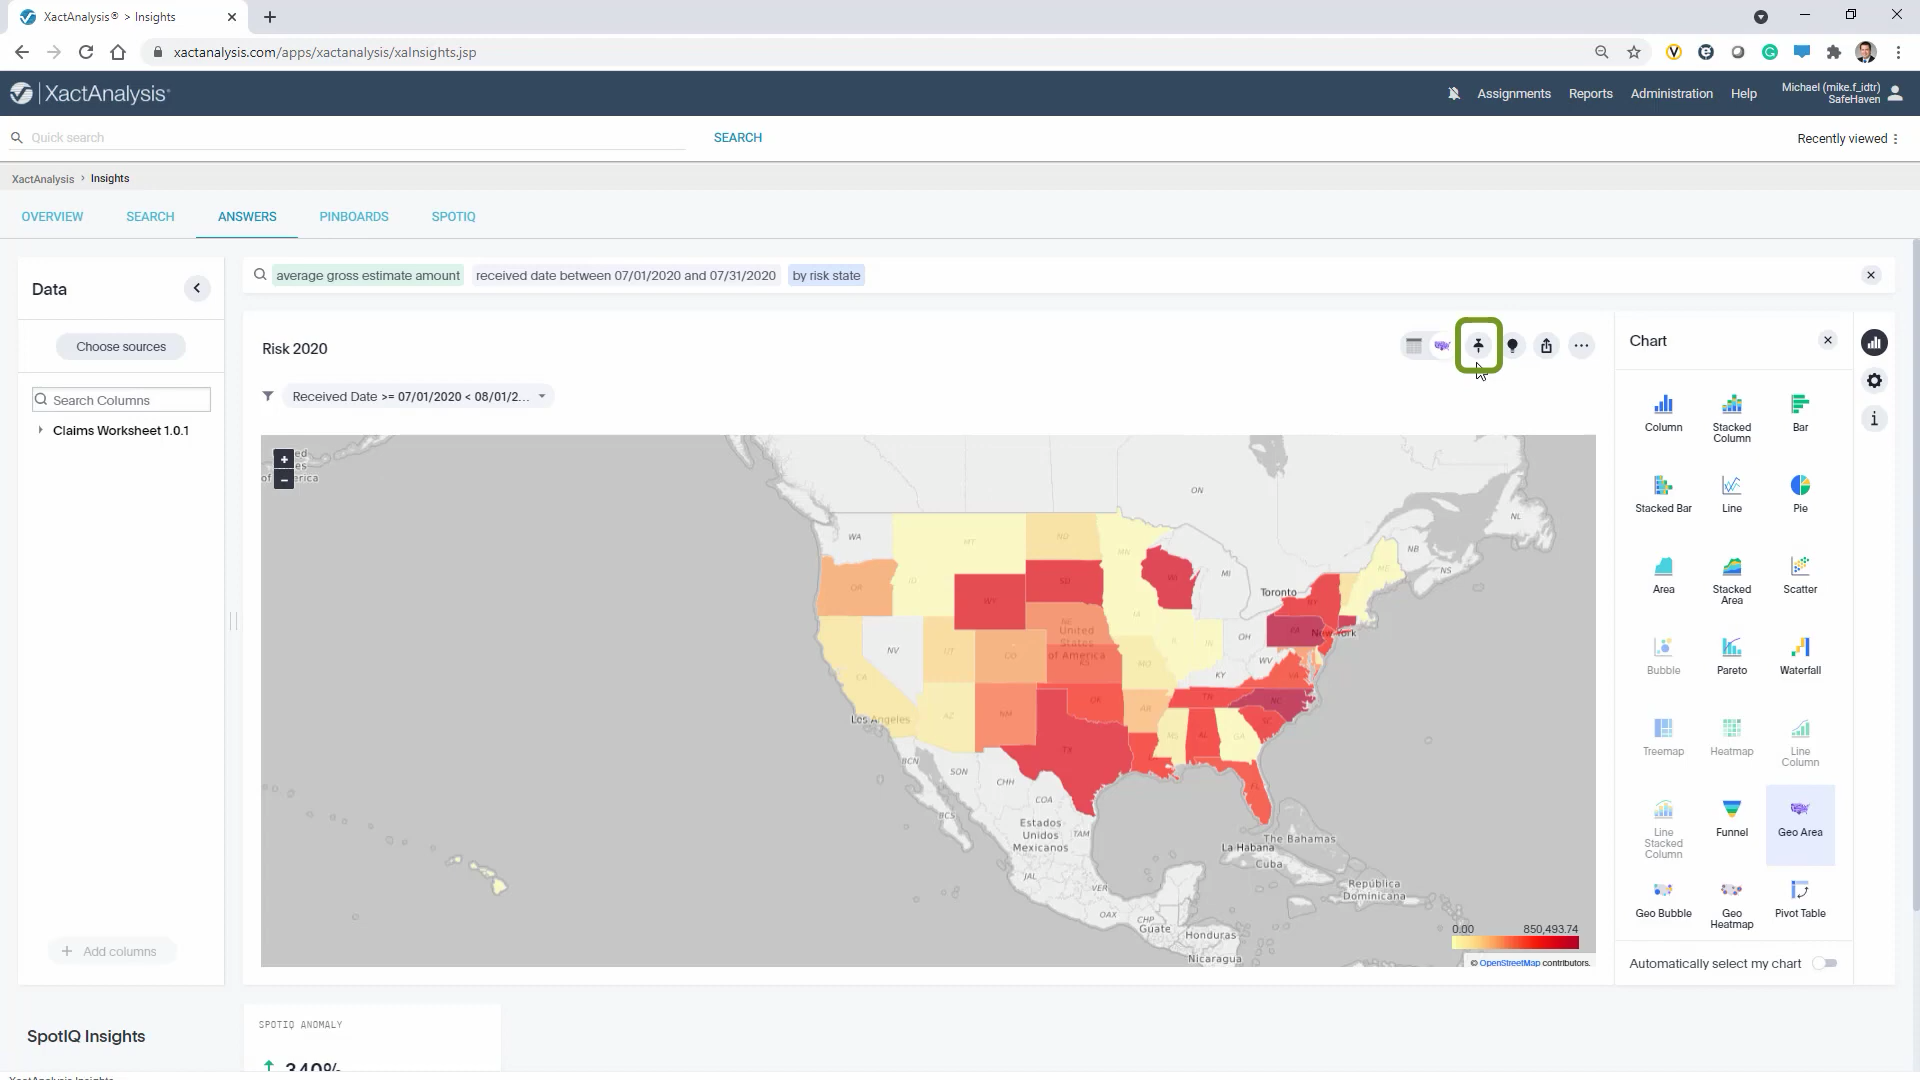
Ask your claims data a question. Get an answer.
Self-service analytics across the whole Verisk network: asked in plain language, answered instantly, and benchmarked against the industry.
Natural-language querying
Ask in familiar industry language and the XactAI Insight Analyst answers instantly: no query builder, no report request, no waiting.
Liveboards that stay alive
Dynamic, shareable dashboards refresh on automated updates, and export to PNG, XLSX, or CSV when you need to take the numbers elsewhere.
Templates for the questions you'll ask anyway
Pre-built views for roofing, flood, industry comparison, and XactXpert rule outcomes: the analyses every claims team ends up needing.
Analytics from the whole suite
Centralizes data from XactAnalysis, ClaimXperience, and XactXpert. XactShare handles data integration, and XactInsights Professional adds custom dashboards.
Measure against the industry, not just last quarter
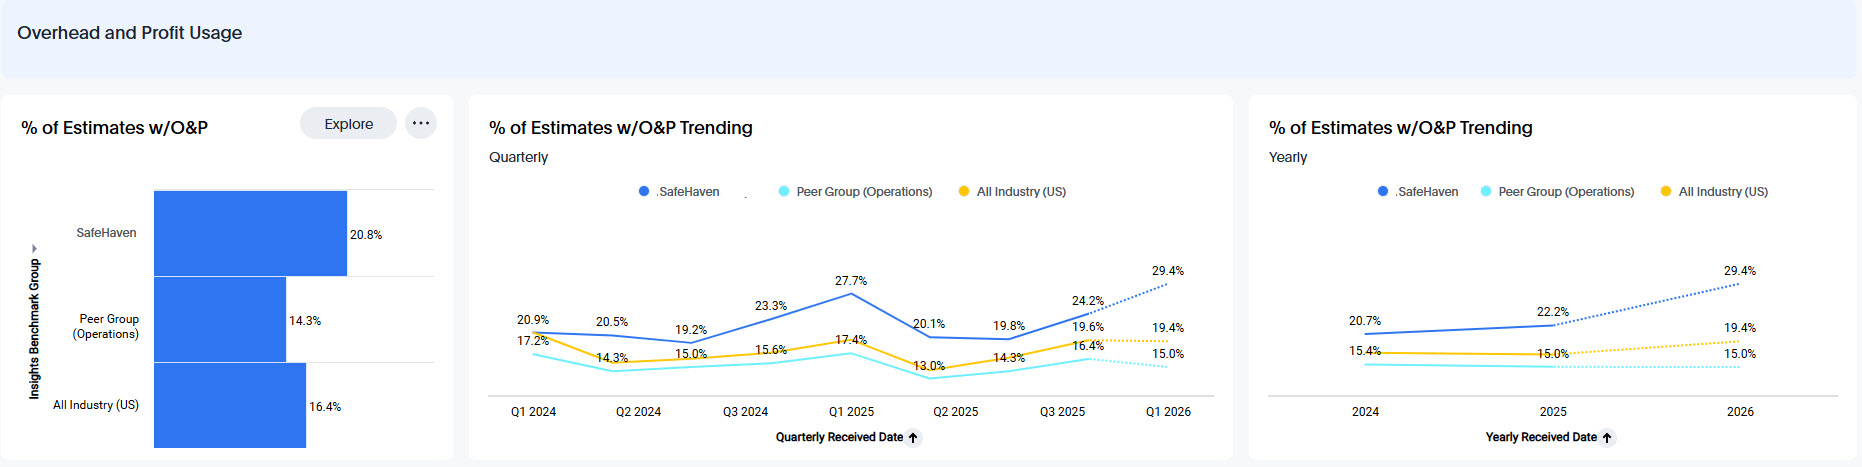
Your cycle times can improve every quarter and still trail the market, and you'd never know it from internal reports alone. XactPulse puts your KPIs against the industry's in real time, so better-than-last-year never gets mistaken for good.
- 30+ measures benchmarked live against the industry
- Root-cause drilldowns, not just red-yellow-green
- Peer-group and AM Best category comparisons
- Verisk consulting to turn a gap into a plan
XactShare: share data seamlessly
A separate product that handles the data integration behind your analytics: use XactShare to integrate data effortlessly, access real-time insights, and make smarter decisions, without implementation hassles.
XactInsights in the claims lifecycle
XactInsights is where the whole lifecycle pays forward: every stage you just read feeds the benchmarks that make the next claim faster, cleaner, and better priced.
See the full life of a claimInside XactInsights reporting
A walkthrough of the Transaction Count Report, one of the ready-made views claims teams lean on daily.
Stop waiting for the quarterly report.
Claims intelligence loses value by the week. Self-service answers in plain language mean decisions happen while the trend is still happening, not a quarter after it ended.
Do more across the claim
XactAnalysis
The network data your benchmarks are built on: assignments, statuses, and estimates from across the industry.
Explore XactAnalysis Quality assuranceXactXpert
See which rules actually move outcomes, and tune your QA program on evidence instead of instinct.
Explore XactXpert CollaborateClaimXperience
Put experience metrics beside operational ones: how the claim felt, next to how it ran.
Explore ClaimXperienceSee it on your own claims data
Licensed per organization, with XactInsights Professional available for custom dashboards. The best demo is your own data. Talk to sales to set one up.
See what your claims data knows
Ask a question in plain language and get an answer you can act on, benchmarked against the whole industry.